Want to know the state of the market so far in 2016? Here’s what the Plymouth housing market looked like throughout 2016…
Listing & Pending Homes in Plymouth
 Data of listed and sold homes in the past 6 months reveals that listed homes had an average list price of $454,872. The ratio of current pending homes (which is the number of pending sales divided by the number of total listings) is 39.6%, which means the current inventory is mildly active.
Sold Homes in Plymouth
In the past 6 months, there were 1257 closed homes in Plymouth alone. The average sold price was $309,373, and most homes that sold were between $200,000 and $300,000. The average list-to-sales ratio was 98.7%, which indicates that sellers came pretty close to receiving their list prices in their final closing.
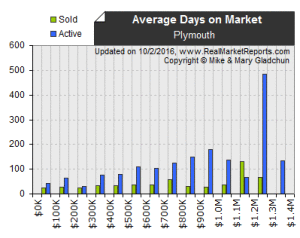
Days on the Plymouth Market
 The number of days a home sits on the market can indicate whether the real estate market is a buyer’s market (lots of homes to choose from) or a seller’s market (very few homes on the market). A higher average DOM (days on the market) indicates that there is a high inventory of homes and the market is a buyer’s market. A low DOM indicates a seller’s market—fewer choices and more competition for buyers.
In the past 6 months, the average DOM for sold properties was 29 days, which indicates a market fairly evenly balanced between buyers and sellers.
The Plymouth Market in the Last 30 Days
In the last 30 days, 27 homes have been closed with an average Days on the Market of 27 days. The average list price was $329,621, and the highest closed homes was a $2.5 million dollar estate!
Want to Know More About the Plymouth Market?
Whether you want to know more about the market in your specific Plymouth neighborhood, or would like some stats on our sold data, then it’s time to contact us to learn more about selling a home in Plymouth, MI!


